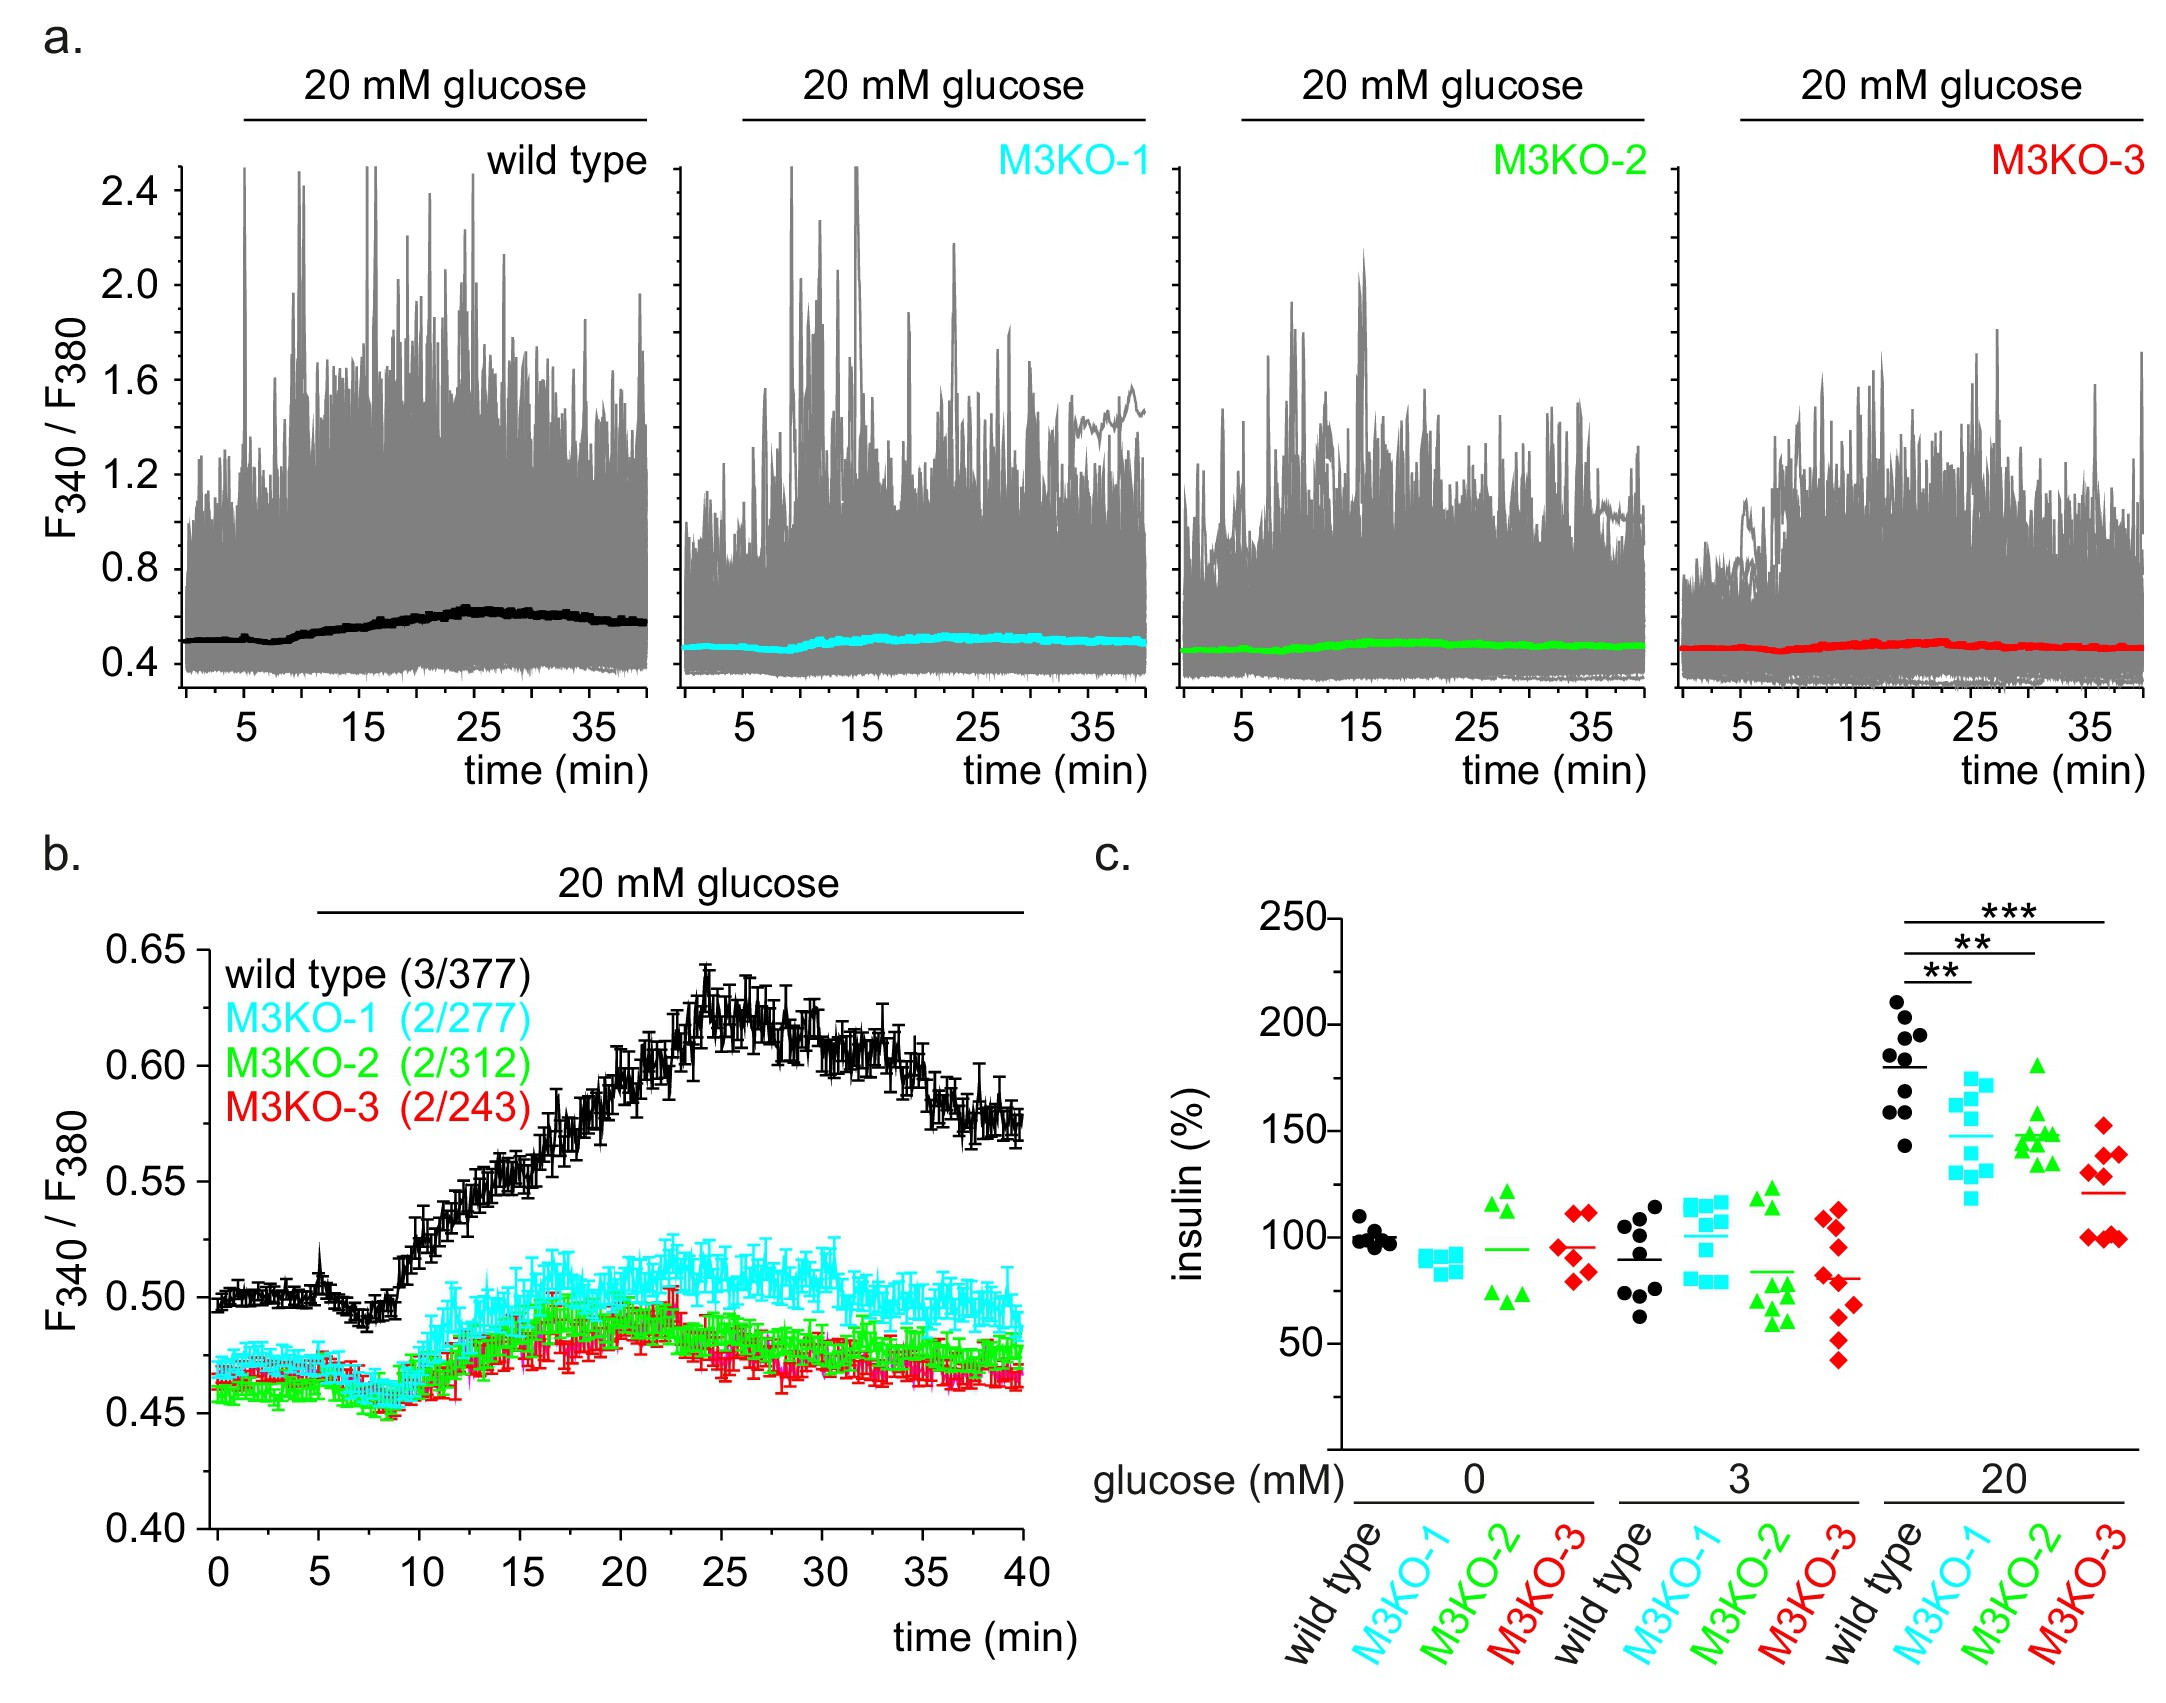
Fig. 4. Reduced glucose-induced increase of [Ca2+]cyt and insulin release in Trpm3 knockout cells. (a) Fura-2 fluorescence ratios recorded in INS-1 cells before and after addition of 20 mM glucose in wild type and the TRPM3-deficient INS-1 cell clones M3KO-1, M3KO-2, and M3KO-3. Measurements of single cells are shown as thin grey traces. Thick traces represent the mean values (± SEM), compared in (b) with numbers of experiments/cells indicated in brackets. (c) Insulin released from wild-type INS-1 cells and Trpm3 knockout INS-1 cell clones in the absence and presence of 3 and 20 mM glucose. Values were normalized to the mean level obtained in wild-type cells in the absence of glucose. Note that all values in 20 mM glucose were significantly different from the corresponding values in 0 mM and 3 mM glucose with p< 0.001 whereas values in 0 and 3 mM glucose were not statistically different from each other.